服务器指标监控
📘 Prometheu + Grafana + Node Exporter 主机监控
介绍
Prometheus 是一款开源的监控与告警系统,由 SoundCloud 在 2012 年开发并于 2015 年加入 CNCF(Cloud Native Computing Foundation)。
它以强大的时序数据存储、灵活的查询语言(PromQL)和自动化的服务发现能力,广泛用于云原生环境中。
| 组件 | 主要作用 |
|---|---|
| Prometheus Server | 负责抓取(Scrape)监控数据、存储时序数据,并提供查询接口 |
| Exporter | 将被监控目标的指标数据转换为 Prometheus 能读取的格式(如 Node Exporter) |
| Pushgateway | 支持短生命周期任务将指标“推送”给 Prometheus(非推荐主流方案) |
| Alertmanager | 处理 Prometheus 发送的告警,支持分组、抑制、路由、通知(Email、Slack 等) |

服务端安装
docker-compose 配置文件
services:
  prometheus:
    image: prom/prometheus:latest
    container_name: prometheus
    restart: unless-stopped
    pull_policy: always
    ports:
      - "9090:9090"
    command:
      - --config.file=/etc/prometheus/prometheus.yml
      - --storage.tsdb.path=/prometheus
      - --storage.tsdb.retention.time=15d
      - --web.enable-lifecycle
    volumes:
      - ./prometheus/prometheus.yml:/etc/prometheus/prometheus.yml:ro
      - ./prometheus/rules:/etc/prometheus/rules:ro
      - prometheus-data:/prometheus
    depends_on:
      - alertmanager
      - blackbox-exporter

  alertmanager:
    image: prom/alertmanager:latest
    container_name: alertmanager
    restart: unless-stopped
    pull_policy: always
    ports:
      - "9093:9093"
    command:
      - --config.file=/etc/alertmanager/alertmanager.yml
    volumes:
      - ./alertmanager/alertmanager.yml:/etc/alertmanager/alertmanager.yml:ro
      - alertmanager-data:/alertmanager

  node-exporter:
    image: prom/node-exporter:latest
    container_name: node-exporter
    restart: unless-stopped
    pull_policy: always
    ports:
      - "9100:9100"
    # 让容器内读取宿主机 /proc /sys 以采集宿主机指标
    pid: "host"
    volumes:
      - /proc:/host/proc:ro
      - /sys:/host/sys:ro
      - /:/rootfs:ro
    command:
      - --path.procfs=/host/proc
      - --path.sysfs=/host/sys
      - --path.rootfs=/rootfs
      - --collector.filesystem.mount-points-exclude=^/(sys|proc|dev|host|etc)($$|/)

  blackbox-exporter:
    image: prom/blackbox-exporter:latest
    container_name: blackbox-exporter
    restart: unless-stopped
    pull_policy: always
    ports:
      - "9115:9115"
    volumes:
      - ./blackbox/blackbox.yml:/etc/blackbox_exporter/config.yml:ro
    command:
      - --config.file=/etc/blackbox_exporter/config.yml

  grafana:
    image: grafana/grafana-oss:latest
    container_name: grafana
    restart: unless-stopped
    pull_policy: always
    ports:
      - "3000:3000"
    environment:
      - GF_SECURITY_ADMIN_USER=admin
      - GF_SECURITY_ADMIN_PASSWORD=admin
    volumes:
      - grafana-data:/var/lib/grafana

volumes:
  prometheus-data:
  alertmanager-data:
  grafana-data:
prometheus 配置文件
global:
  scrape_interval: 15s
  evaluation_interval: 15s
  scrape_timeout: 10s

alerting:
  alertmanagers:
    - static_configs:
        - targets: ["alertmanager:9093"]

rule_files:
  - /etc/prometheus/rules/*.yml

scrape_configs:
  - job_name: "prometheus"
    static_configs:
      - targets: ["prometheus:9090"]

  - job_name: "node-exporter"
    static_configs:
      - targets: ["node-exporter:9100"]
        labels:
          instance: "Prometheus-Instance"
          nodename: "Prometheus-NodeName"
alertmanager 配置文件
route:
  receiver: "null"

receivers:
  - name: "null"
    # 示例:改成邮箱/企业微信/钉钉/Slack/Webhook 等
    # email_configs:
    #   - to: "ops@example.com"
访问
- Prometheus: http://localhost:9090
- Grafana: http://localhost:3000 (默认 admin / admin)
客户端安装 Node Exporter 组件
#!/bin/bash
# ============================================================
# Node Exporter 安装脚本 - 适用于 Debian 13 / Ubuntu
# 版本:v1.9.1
# 作者:胖哥
# 站点:https://digvps.com/
# ============================================================

set -e

VERSION="1.10.2"
ARCH="linux-amd64"
DOWNLOAD_URL="https://github.com/prometheus/node_exporter/releases/download/v${VERSION}/node_exporter-${VERSION}.${ARCH}.tar.gz"

echo "📦 下载 Node Exporter v${VERSION} ..."
wget -q ${DOWNLOAD_URL} -O /tmp/node_exporter.tar.gz

echo "📂 解压文件 ..."
tar -xzf /tmp/node_exporter.tar.gz -C /tmp
cd /tmp/node_exporter-${VERSION}.${ARCH}

echo "🚀 安装二进制到 /usr/local/bin ..."
cp node_exporter /usr/local/bin/
chmod +x /usr/local/bin/node_exporter

echo "👤 创建 nodeusr 用户(如不存在)..."
if ! id "nodeusr" &>/dev/null; then
  useradd --no-create-home --shell /usr/sbin/nologin nodeusr
fi

echo "🧾 创建 systemd 服务文件 ..."
cat >/etc/systemd/system/node_exporter.service <<'EOF'
[Unit]
Description=Prometheus Node Exporter
Documentation=https://github.com/prometheus/node_exporter
After=network-online.target

[Service]
User=nodeusr
Group=nodeusr
Type=simple
ExecStart=/usr/local/bin/node_exporter \
  --web.listen-address=":9100"

Restart=on-failure

[Install]
WantedBy=multi-user.target
EOF

echo "🔄 重新加载 systemd 守护进程 ..."
systemctl daemon-reload

echo "▶️ 启动 Node Exporter 服务 ..."
systemctl enable --now node_exporter

echo "✅ Node Exporter 安装完成!"
echo "------------------------------------------------------------"
echo "访问地址: http://<服务器IP>:9100/metrics"
echo "服务状态: systemctl status node_exporter"
echo "日志查看: journalctl -u node_exporter -f"
echo "------------------------------------------------------------"
📘 Prometheu + Alertmanager 警告配置
警告规则配置
服务器离线(Node Down)
groups:
  - name: node_down
    rules:
      - alert: NodeDown
        expr: up{job="node-exporter"} == 0
        for: 1m
        labels:
          severity: critical
        annotations:
          summary: "💀 节点 {{ $labels.instance }} 离线"
          description: "Exporter 无法连接(可能服务器宕机或网络故障)"
CPU 使用率过高
groups:
  - name: node_cpu
    rules:
      - alert: HighCPUUsage
        expr: 100 - (avg by (instance) (rate(node_cpu_seconds_total{mode="idle"}[5m])) * 100) > 90
        for: 2m
        labels:
          severity: warning
        annotations:
          summary: "🔥 CPU 使用率过高 ({{ $labels.instance }})"
          description: "当前 CPU 使用率超过 90%"
内存使用率过高
groups:
  - name: node_memory
    rules:
      - alert: HighMemoryUsage
        expr: (1 - node_memory_MemAvailable_bytes / node_memory_MemTotal_bytes) * 100 > 90
        for: 2m
        labels:
          severity: warning
        annotations:
          summary: "💾 内存使用率过高 ({{ $labels.instance }})"
          description: "当前内存使用率已超过 90%"
网络流量异常(例如上行/下行过高)
groups:
  - name: node_memory
    rules:
      - alert: HighMemoryUsage
        expr: (1 - node_memory_MemAvailable_bytes / node_memory_MemTotal_bytes) * 100 > 90
        for: 2m
        labels:
          severity: warning
        annotations:
          summary: "💾 内存使用率过高 ({{ $labels.instance }})"
          description: "当前内存使用率已超过 90%"
磁盘使用
groups:
  - name: node_disk
    rules:
      # 1) 磁盘使用率过高(Warning / Critical)
      - alert: DiskUsageHigh
        expr: |
          100 * (1 - node_filesystem_avail_bytes{fstype!~"tmpfs|overlay|squashfs|devtmpfs|nsfs|tracefs|cgroup2.*|autofs|proc|sysfs|bpf|ramfs"}
                     / node_filesystem_size_bytes{fstype!~"tmpfs|overlay|squashfs|devtmpfs|nsfs|tracefs|cgroup2.*|autofs|proc|sysfs|bpf|ramfs"}) > 90
        for: 5m
        labels:
          severity: critical
        annotations:
          summary: "📦 磁盘使用率过高 ({{ $labels.instance }} {{ $labels.mountpoint }})"
          description: "磁盘使用率 > 90% 持续 5 分钟;当前值={{ $value | printf \"%.1f\" }}%"

      - alert: DiskUsageHigh
        expr: |
          100 * (1 - node_filesystem_avail_bytes{fstype!~"tmpfs|overlay|squashfs|devtmpfs|nsfs|tracefs|cgroup2.*|autofs|proc|sysfs|bpf|ramfs"}
                     / node_filesystem_size_bytes{fstype!~"tmpfs|overlay|squashfs|devtmpfs|nsfs|tracefs|cgroup2.*|autofs|proc|sysfs|bpf|ramfs"}) > 80
        for: 10m
        labels:
          severity: warning
        annotations:
          summary: "📦 磁盘使用率偏高 ({{ $labels.instance }} {{ $labels.mountpoint }})"
          description: "磁盘使用率 > 80% 持续 10 分钟;当前值={{ $value | printf \"%.1f\" }}%"

      # 2) inode 使用率过高(防止“有空间但没 inode”)
      - alert: InodeUsageHigh
        expr: |
          100 * (1 - node_filesystem_files_free{fstype!~"tmpfs|overlay|squashfs|devtmpfs|nsfs|tracefs|cgroup2.*|autofs|proc|sysfs|bpf|ramfs"}
                     / node_filesystem_files{fstype!~"tmpfs|overlay|squashfs|devtmpfs|nsfs|tracefs|cgroup2.*|autofs|proc|sysfs|bpf|ramfs"}) > 80
        for: 10m
        labels:
          severity: warning
        annotations:
          summary: "📁 inode 使用率偏高 ({{ $labels.instance }} {{ $labels.mountpoint }})"
          description: "inode 使用率 > 80% 持续 10 分钟;当前值={{ $value | printf \"%.1f\" }}%"
Alertmanager 通知配置
global:
  resolve_timeout: 5m

  # 邮件全局配置
  smtp_smarthost: 'smtp.gmail.com:587'
  smtp_from: 'alert@example.com'
  smtp_auth_username: 'alert@example.com'
  smtp_auth_password: 'your_password_here'

route:
  # 根路由定义
  receiver: 'telegram'                 # 👈 默认分发到 all 这个 receiver
  group_by: ['alertname']         # 按告警名分组
  group_wait: 10s
  group_interval: 10s
  repeat_interval: 1h

  # 这里可以做条件分发(示例)
  # routes:
  #   - match:
  #       severity: critical
  #     receiver: 'telegram'
  #   - match:
  #       severity: warning
  #     receiver: 'email'

receivers:
  # 🔔 同时发送邮件 + Telegram 的复合接收器
  - name: 'all'
    email_configs:
      - to: 'admin@example.com'
        send_resolved: true
    telegram_configs:
      - bot_token: '123456789:ABCDEF_xxxxx'
        chat_id: -1001234567890
        parse_mode: 'HTML'
        send_resolved: true
        message: |-
          🚨 <b>{{ .Status | toUpper }}</b> - {{ .CommonLabels.alertname }}
          主机: {{ .CommonLabels.instance }}
          严重性: {{ .CommonLabels.severity }}
          详情: {{ .CommonAnnotations.summary }}
          描述: {{ .CommonAnnotations.description }}
          <i>触发时间: {{ .StartsAt }}</i>

  # 你也可以定义单独渠道备用
  - name: 'email'
    email_configs:
      - to: 'ops@example.com'
        send_resolved: true

  - name: 'telegram'
    telegram_configs:
      - bot_token: '123456789:ABCDEF_xxxxx'
        chat_id: -1001234567890
        parse_mode: 'Markdown'
        send_resolved: true
        message: |-
          🚨 *{{ .Status | toUpper }}* - {{ .CommonLabels.alertname }}

          主机: {{ .CommonLabels.instance }}
          严重性: {{ .CommonLabels.severity }}
          详情: {{ .CommonAnnotations.summary }}
          描述: {{ .CommonAnnotations.description }}

          触发时间: {{ .StartsAt }}
测试验证
重新加载 Prometheus
curl -X POST http://localhost:9090/-/reload
测试 Alertmanager 发送警告
# 发送
curl -X POST http://localhost:9093/api/v2/alerts \
  -H 'Content-Type: application/json' \
  -d '[
    {
      "labels": {
        "alertname": "ManualTest",
        "severity": "warning",
        "instance": "test-node"
      },
      "annotations": {
        "summary": "Manual test from curl",
        "description": "Verifying email + Telegram routes."
      },
      "startsAt": "'$(date -Is)'",
      "endsAt":   "'$(date -Is -d "+10 minutes")'"
    }
  ]'


# 恢复
curl -X POST http://localhost:9093/api/v2/alerts \
  -H 'Content-Type: application/json' \
  -d '[
    {
      "labels": { "alertname": "ManualTest", "severity": "warning", "instance": "test-node" },
      "startsAt": "'$(date -Is -d "-2 minutes")'",
      "endsAt":   "'$(date -Is -d "-1 minutes")'"
    }
  ]'
📘 哪吒监控 V1
开源、轻量、易用的服务器监控与运维工具。
视频教程
请务必结合视频教程食用,因为细节内容都在视频中讲解,本文主要供小伙伴们拷贝代码用途。
哪吒面板
docker-compose配置文件
services:
  dashboard:
    image: ghcr.io/nezhahq/nezha
    container_name: nezha-dashboard
    restart: always
    volumes:
      - ./data:/dashboard/data
    ports:
      - 8008:8008
面板配置文件
debug: false
realipheader: ""
language: zh_CN
sitename: DigVPS.COM
jwtsecretkey: 75VV5b9jtTGCktY8XuoK0BhCp2hMcMEVP9XXk3WVUf0PEpyYvFUWOxXGczyWVDCvwUVvzusZL54AvZfdkjmzU45f1lJ64zjr0uNasJ8KsCDlHkQN3ODRstVojGC1S4WRcQb2S3BZj5mZVVRjb0GZZdmFybpmx7DSZJUtGIftkRmGvEywDTepUXEpysMaAulVrdkI920Zt7YZhkAdsc3qMw1hpUD6r8q0ERWugdkf1BjTBHFtHTYPka7lri7HQcdRRIB11f5pmbejjBtVwfzV4lM8eTaz0j0SwKMC2le3SejoriHvcH3sbnhfuGJY9ZfmJKnhACBllxt9NuQjDFcstLztNi79aT5wDsrwHmFS8N7CriXwhyR0DdFRQiitX0tWp4X7SLhYyiLuqGgq4bmNlIkGIKdmcFupDT3YA8Pi0qgVnPTFA2nCRyYfCgCkzRb7M4Gym9EaaSrp5gHJGo5uyOh81iXNkJSlyXH1kwc7MAqrLD5gq3jpSF54jciNy0yGtQTNCh98Nz3qeWGw9bT0lOAcSEtnZlvKNc4fvaBFU3c9Js1V4B1pTGFjdZJvVRaEuD065kkORtxR6eaKmo5NBv5qNk32lsxcCaOiuYNMCHFtGbUWGmCKct3rtk6kzh0lGfImYlHzo2xu0IiytAs11FDzUE7fT1yugf3wcJ2GboDol8r12anMgleHZevFx8LI9O3Gf3UgkbIaqHVYc7njTl41r489wte7vuXur2A0dyv5MSR8PJ0TeLdWsSbLVHxfkZ0yYM5HAChnGInCkkgPE3DFfG6ukjQmpu3m3KGK0JMfHqbg1XjA7gVVCFcImZ1iJSbhK77N17fkN8HErNt5Dbqp4tJ74RWy3N1bcKDki3YODeU64fQudHqv4U7EDpy3IIEBChGLXcXEl7ZkJDE7CmY5cbfCCA7zALHdcGVcCU3sW0l1B4coYRqYJPPA1nnLzUdZUwsJoT3GpkfOMdx9tgQcMZVuVDdmqjtbBpkZ1GsqftKY6D3DqavEcj2vjEqN
agentsecretkey: WYGjFRqQPhcBCfmfPoXMjXUNIanxceKw
listenport: 8008
listenhost: ""
installhost: DigVPS.COM #客户端需要连接的服务器域名或者IP,请改为你自己的。
tls: true
location: Asia/Shanghai
enableplainipinnotification: false
enableipchangenotification: false
ipchangenotificationgroupid: 0
cover: 1
ignoredipnotification: ""
ignoredipnotificationserverids: {}
avgpingcount: 2
dnsservers: ""
customcode: ""
customcodedashboard: ""
反代配置
underscores_in_headers on;
ignore_invalid_headers off;

location /dashboard {
    proxy_pass http://$server:$port;
    proxy_set_header Host $http_host;
    proxy_set_header      Upgrade $http_upgrade;
}
# websocket 相关
location ~* ^/api/v1/ws/(server|terminal|file)(.*)$ {
    proxy_set_header Host $host;
    proxy_set_header nz-realip $remote_addr;
    proxy_set_header Origin https://$host;
    proxy_set_header Upgrade $http_upgrade;
    proxy_set_header Connection "upgrade";
    proxy_read_timeout 3600s;
    proxy_send_timeout 3600s;
    proxy_pass http://$server:$port;
}
# grpc 相关
location ^~ /proto.NezhaService/ {
    grpc_set_header Host $host;
    grpc_set_header nz-realip $remote_addr;
    grpc_set_header client_secret $http_client_secret;
    grpc_set_header client_uuid $http_client_uuid;
    grpc_read_timeout 600s;
    grpc_send_timeout 600s;
    grpc_socket_keepalive on;
    client_max_body_size 10m;
    grpc_buffer_size 4m;
    grpc_pass grpc://$server:$port;
}
📘 哪吒监控 V0
开源、轻量、易用的服务器监控与运维工具。
视频教程
请务必结合视频教程食用,因为细节内容都在视频中讲解,本文主要供小伙伴们拷贝代码用途。
安装
接入GitHub作为后台管理员账号
- 打开Developer Settings,依次选择
OAuth Apps-New OAuth App新建授权应用。 - 填写应用信息
Application name- 随意填写Homepage URL- 填写面板的访问域名,如:"https://bigdata.icu/"Authorization callback URL- 填写回调地址,如:"https://bigdata.icu/oauth2/callback"
Register application注册应用
运行面板安装脚本
# GitHub 源
curl -L https://raw.githubusercontent.com/naiba/nezha/master/script/install.sh  -o nezha.sh && chmod +x nezha.sh && sudo ./nezha.sh
# Gitee 源
curl -L https://gitee.com/naibahq/nezha/raw/master/script/install.sh -o nezha.sh && chmod +x nezha.sh && sudo CN=true ./nezha.sh
填写相关信息
请输入 OAuth2 提供商(github/gitlab/jihulab/gitee,默认 github):- 直接回车,默认github请输入 Oauth2 应用的 Client ID:- 输入刚才GitHub创建的授权应用的Client ID请输入 Oauth2 应用的 Client Secret:- 点击授权应用中的Generate a new client secret请输入 GitHub/Gitee 登录名作为管理员,多个以逗号隔开:- 填写你的用户名,不是你登陆的账号或者自定义的别名,比如我的项目地址是 https://github.com/bihell,后面的`bihell`就是用户名。请输入站点标题:- 随意输入站点访问端口: (默认 8008)- 服务面板的访问端口请输入用于 Agent 接入的 RPC 端口: (默认 5555)- 客户端和服务面板的通讯端口
Docker 部署文件
::: tip
如果有自己的Docker服务器,不想使用官方的一键脚本。那么直接修改配置文件/data/config.yaml把oauth2该为自己的,然后部署即可。
如果你正在使用TrueNAS,或者对NAS感兴趣,那么可以参考我《TrueNAS Scale终极教程》来自定义APP安装哪吒监控。 :::
配置文件地址:https://github.com/bihell/nezha-docker
反代配置
#PROXY-START/
location / {
    proxy_pass http://192.168.50.116:8008;
    proxy_set_header Host $http_host;
    proxy_set_header      Upgrade $http_upgrade;
}
location ~ ^/(ws|terminal/.+)$  {
    proxy_pass http://192.168.50.116:8008;
    proxy_http_version 1.1;
    proxy_set_header Upgrade $http_upgrade;
    proxy_set_header Connection "Upgrade";
    proxy_set_header Host $http_host;
}
#PROXY-END/
Agent 设置
设定Agent数据传输域名/IP
Settings->Dashboard Server Domain/IP without CDN
在 OpenWRT 中安装 Agent
- 下载release的二进制包,解压到
/opt,运行chmod +x /opt/nezha-agent赋予执行权限 - 创建
/etc/init.d/nezha-service:
#!/bin/sh /etc/rc.common

START=99
USE_PROCD=1

start_service() {
 procd_open_instance
 procd_set_param command /opt/nezha-agent -s 面板通信地址:端口 -p 秘钥 -d
 procd_set_param respawn
 procd_close_instance
}

stop_service() {
    killall nezha-agent
}

restart() {
 stop
 sleep 2
 start
}
- 运行
chmod +x /etc/init.d/nezha-service赋予执行权限 - 启动服务:
/etc/init.d/nezha-service enable && /etc/init.d/nezha-service start
自定义的网卡和分区
执行/opt/nezha/agent/nezha-agent --edit-agent-config
其他运行参数
编辑/etc/systemd/system/nezha-agent.service然后在 ExecStart= 这一行的末尾加上参数
参数清单:
--report-delay控制系统信息上报的间隔,默认为 1 秒,可以设置为 3 来进一步降低 agent 端系统资源占用(配置区间 1-4)--skip-conn不监控连接数,推荐 机场/连接密集型 服务器或CPU占用较高的服务器设置--skip-procs不监控进程数,也可以降低 Agent 占用--disable-auto-update禁止 自动更新 Agent(安全特性)--disable-force-update禁止 强制更新 Agent(安全特性)--disable-command-execute禁止在 Agent 上执行定时任务、打开在线终端(安全特性)--tls启用 SSL/TLS 加密(使用 nginx 反向代理 Agent 的 grpc 连接,并且 nginx 开启 SSL/TLS 时,需要启用该项配置)
重启服务:
# 手动编辑
sudo vim /etc/systemd/system/nezha-agent.service
sudo systemctl daemon-reload
sudo systemctl restart nezha-agent
sudo systemctl status nezha-agent

# 直接修改,禁用Agent自动更新命令
sed -i '/^ExecStart=/ {/"--disable-auto-update"/! s/$/ "--disable-auto-update"/}' /etc/systemd/system/nezha-agent.service && systemctl daemon-reload
延迟监控
| 地区 | 电信 | 移动 | 联通 | 教育 |
|---|---|---|---|---|
| 上海 | 202.96.209.133 | 221.183.90.237 | 210.22.97.1 | 202.120.2.119 |
| 北京 | 49.7.37.74 | 112.34.111.194 | 111.206.209.44 | 166.111.4.100 |
| 广州 | 183.47.126.35 | 120.233.18.250 | 157.148.58.29 | 202.116.64.8 |
| 深圳 | 218.17.11.168 | 120.196.165.24 | 58.250.90.114 | |
| 河北 | 27.185.242.215 | 111.62.229.100 | 61.182.138.156 | |
| 山西 | 1.71.157.41 | 183.201.244.91 | 60.221.18.41 | |
| 辽宁 | 123.184.58.41 | 36.131.156.145 | 218.61.211.132 | |
| 吉林 | 123.172.127.217 | 111.27.127.176 | 122.143.8.41 | |
| 黑龙江 | 42.101.84.132 | 111.42.190.25 | 113.7.211.140 | |
| 江苏 | 58.215.210.220 | 36.156.92.132 | 122.96.235.165 | |
| 浙江 | 115.220.14.91 | 117.147.213.41 | 101.69.194.224 | |
| 安徽 | 223.247.108.251 | 112.29.198.100 | 112.132.208.41 | |
| 福建 | 106.126.10.28 | 112.50.96.88 | 36.248.48.139 | |
| 江西 | 106.227.22.132 | 117.168.150.249 | 116.153.69.224 | |
| 山东 | 144.123.160.140 | 120.220.145.91 | 112.240.56.143 | |
| 河南 | 171.15.110.220 | 111.7.99.220 | 123.6.65.101 | |
| 湖北 | 111.170.8.60 | 111.47.131.101 | 122.189.226.138 | |
| 湖南 | 113.240.117.108 | 120.226.192.91 | 116.162.28.220 | |
| 广东 | 183.36.23.111 | 183.240.65.191 | 112.90.211.100 | |
| 海南 | 124.225.43.220 | 111.29.29.219 | 153.0.226.35 | |
| 四川 | 118.123.218.220 | 183.220.151.41 | 101.206.163.49 | |
| 贵州 | 58.42.61.132 | 61.243.18.220 | 117.187.254.132 | |
| 云南 | 222.221.102.220 | 36.147.44.219 | 14.204.150.41 | |
| 陕西 | 124.115.14.100 | 111.19.148.100 | 123.139.127.132 | |
| 甘肃 | 118.182.228.91 | 117.157.16.41 | 59.81.94.53 | |
| 青海 | 223.221.216.219 | 111.12.152.170 | 116.177.237.137 | |
| 内蒙古 | 110.76.186.70 | 117.161.76.41 | 116.114.98.41 | |
| 广西 | 222.217.93.55 | 36.136.112.41 | 171.39.5.51 | |
| 西藏 | 113.62.176.89 | 117.180.234.41 | 43.242.165.35 | |
| 宁夏 | 222.75.44.220 | 111.51.155.214 | 116.129.226.28 | |
| 新疆 | 110.157.243.45 | 36.189.208.164 | 116.178.77.40 | |
| 天津 | 42.81.98.35 | 111.31.236.35 | 116.78.119.56 | |
| 重庆 | 119.84.131.101 | 221.178.81.101 | 221.7.92.98 |
Dashboard 配置
懒人配置生成器: https://nz.sina.us.kg/
调整最大TCPPing值
修改文件:/nezha/data/config.yaml,调整MaxTCPPingValue值。
隐藏服务中的状态文字
Settings->Custom Codes (Style and Script)
<style>
.service-status .delay-today-text{display: none;visibility: hidden;}
</style>
设置页面宽度
<style>
.container {
  width: 1540px;
}
</style>
隐藏地区图标
在 console 里面执行以下js语句
document.querySelectorAll("i.fi").forEach(el => el.classList = [])
设置主题默认为分组模式
<script>
  localStorage.setItem('showGroup', 'true');
</script>
服务器监控
基本规则
type:可选取一个或多个类型,如在一个规则中选择了多个类型,需要同时满足所有选择的类型才会触发通知(可参考后面的示例)cpu、memory、swap、disknet_in_speed入站网速、net_out_speed出站网速、net_all_speed双向网速、transfer_in入站流量、transfer_out出站流量、transfer_all双向流量offline离线监控load1、load5、load15负载process_count进程数 目前取线程数占用资源太多,暂时不支持tcp_conn_count、udp_conn_count连接数
duration:持续数秒,数秒内采样记录 30% 以上触发阈值才会报警(防数据插针)min或max:- 流量、网速类数值 为字节(1KB=1024B,1MB = 1024*1024B)
- 内存、硬盘、CPU 以占用百分比计数
- 离线监控无需设置此项
cover:0监控所有,通过ignore忽略特定服务器1忽略所有,通过ignore监控特定服务器- 例如:
[{"type":"offline","duration":10, "cover":0, "ignore":{"5": true}}]
ignore: 选择忽略特定服务器,搭配cover使用,内容为服务器 id 和布尔值,例如:{"1": true, "2":false}
流量监控
属性:
type:transfer_in_cycle周期内的入站流量transfer_out_cycle周期内的出站流量transfer_all_cycle周期内双向流量和
cycle_start: 统计周期开始日期(可以是你机器计费周期的开始日期),时间格式为RFC3339,例如北京时间为2022-01-11T08:00:00.00+08:00cycle_interval:每隔多少个周期单位(例如,周期单位为天,该值为 7,则代表每隔 7 天统计一次)cycle_unit统计周期单位,默认hour,可选(hour,day,week,month,year)min/max、cover、ignore参考基本规则配置
配置:
[{"type":"transfer_all_cycle","max":1649267441408,"cycle_start":"2024-03-08T00:00:00+08:00","cycle_interval":1,"cycle_unit":"month","cover":1,"ignore":{"100":true}}]
报警机器人
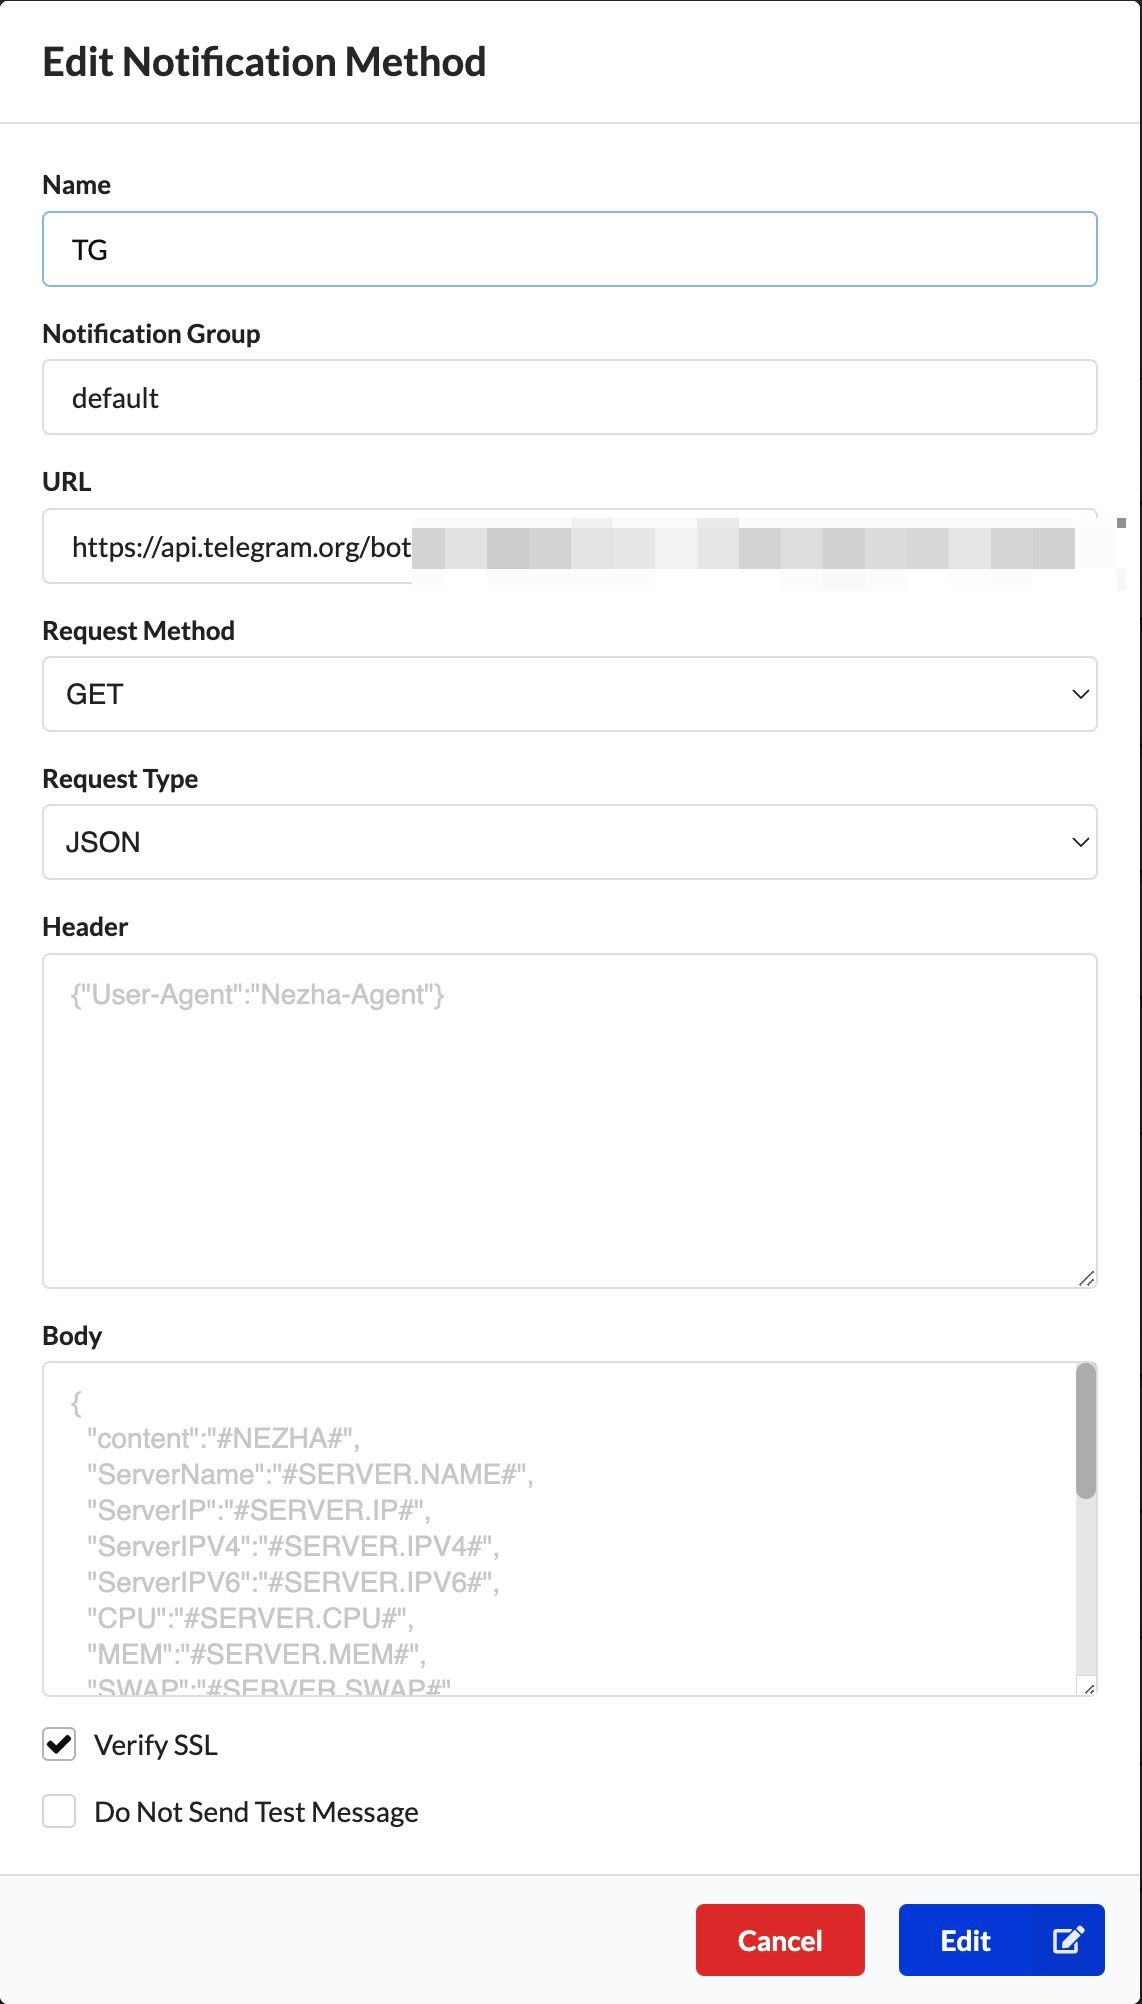
Telegram
关注官方机器人@Botfather,创建机器人
访问地址:https://api.telegram.org/bot这里填写密钥/sendMessage?chat_id=这里填写用户id&text=#NEZHA#
密钥就是机器人创建后
@Botfather返回的 token
id可以通过与机器人@userinfobot对话获得
创建好机器人之后我们先要与其对话一次才可使用
Notifications->Add Notification Method
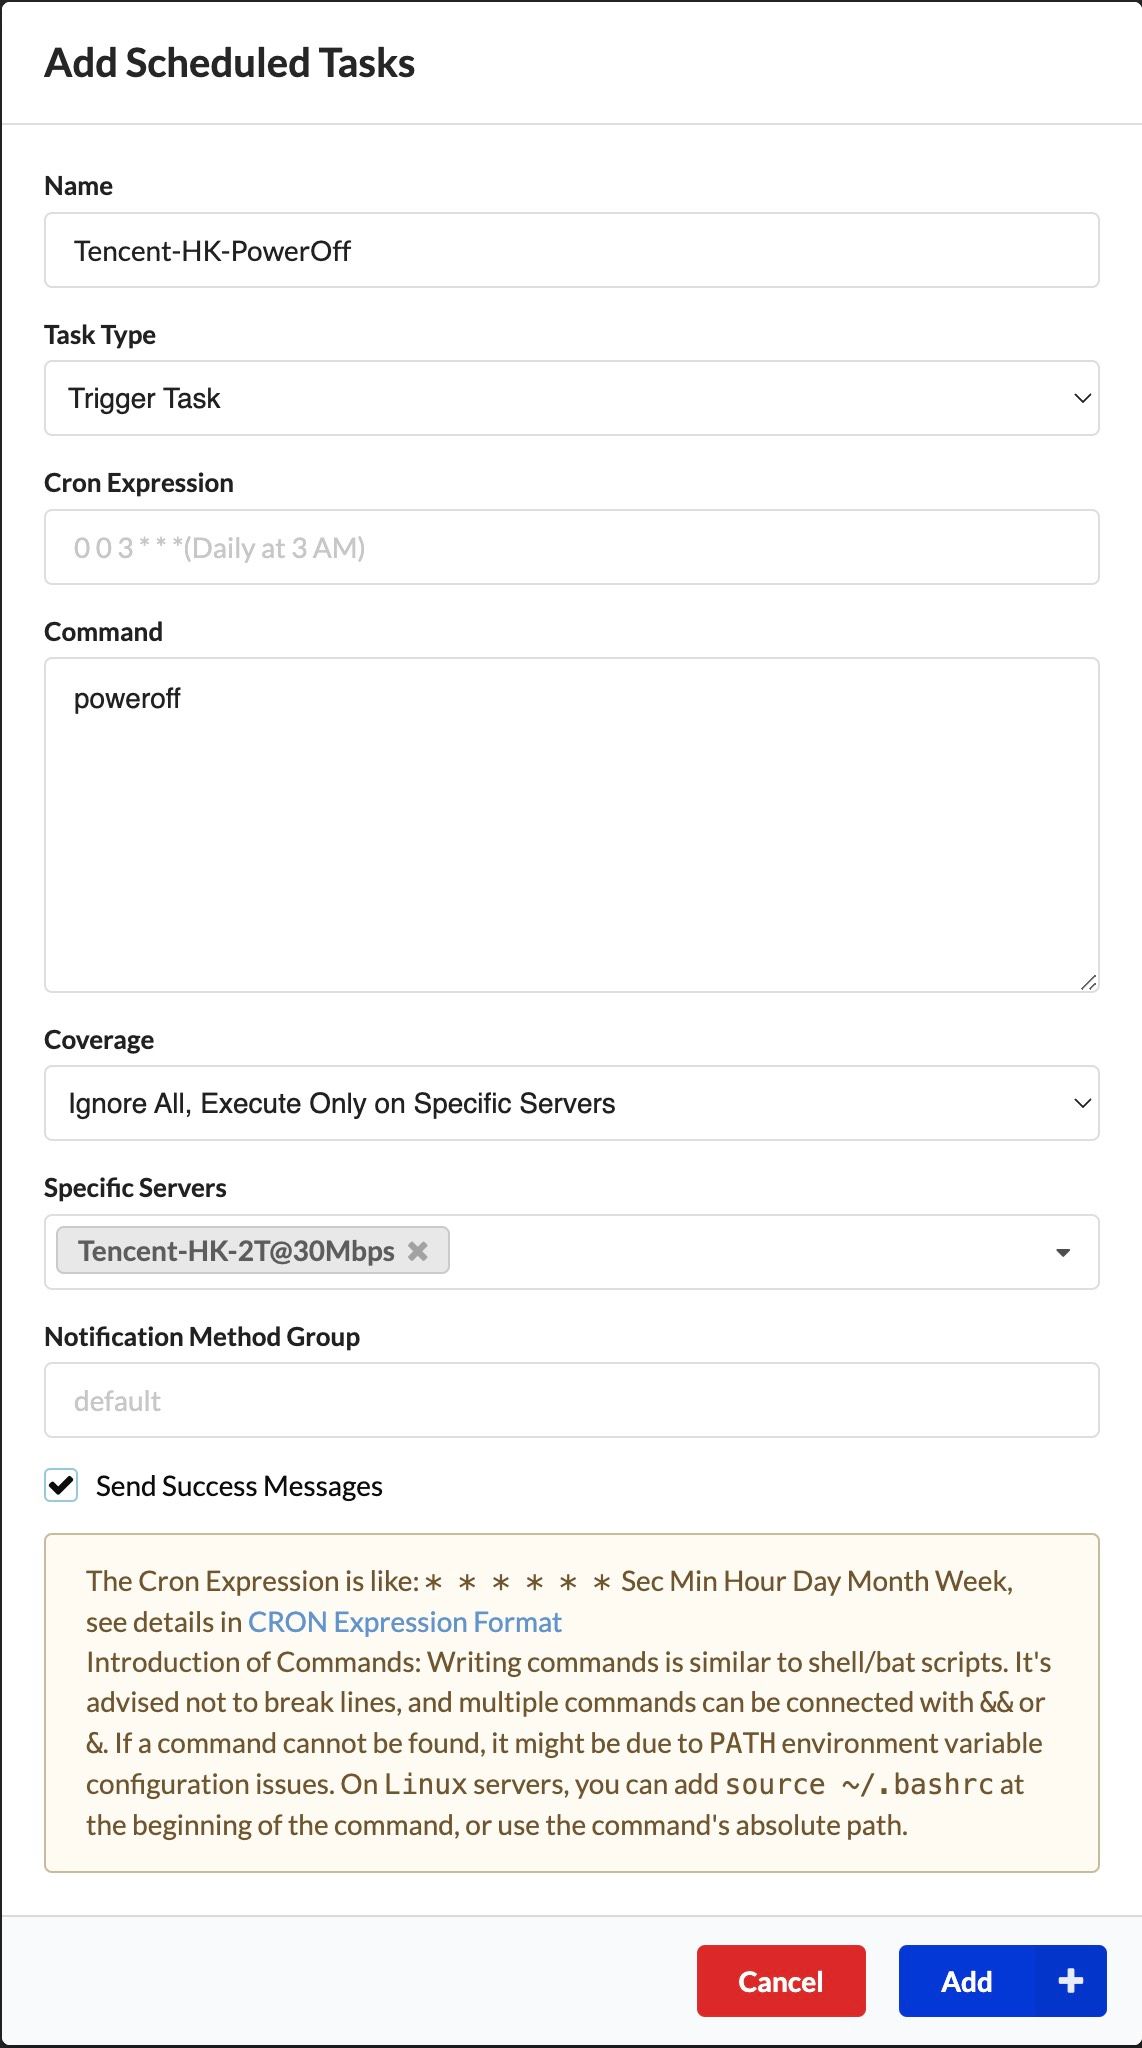
到达额定流量关机
配置关机任务
Tasks->Add Schedule Task
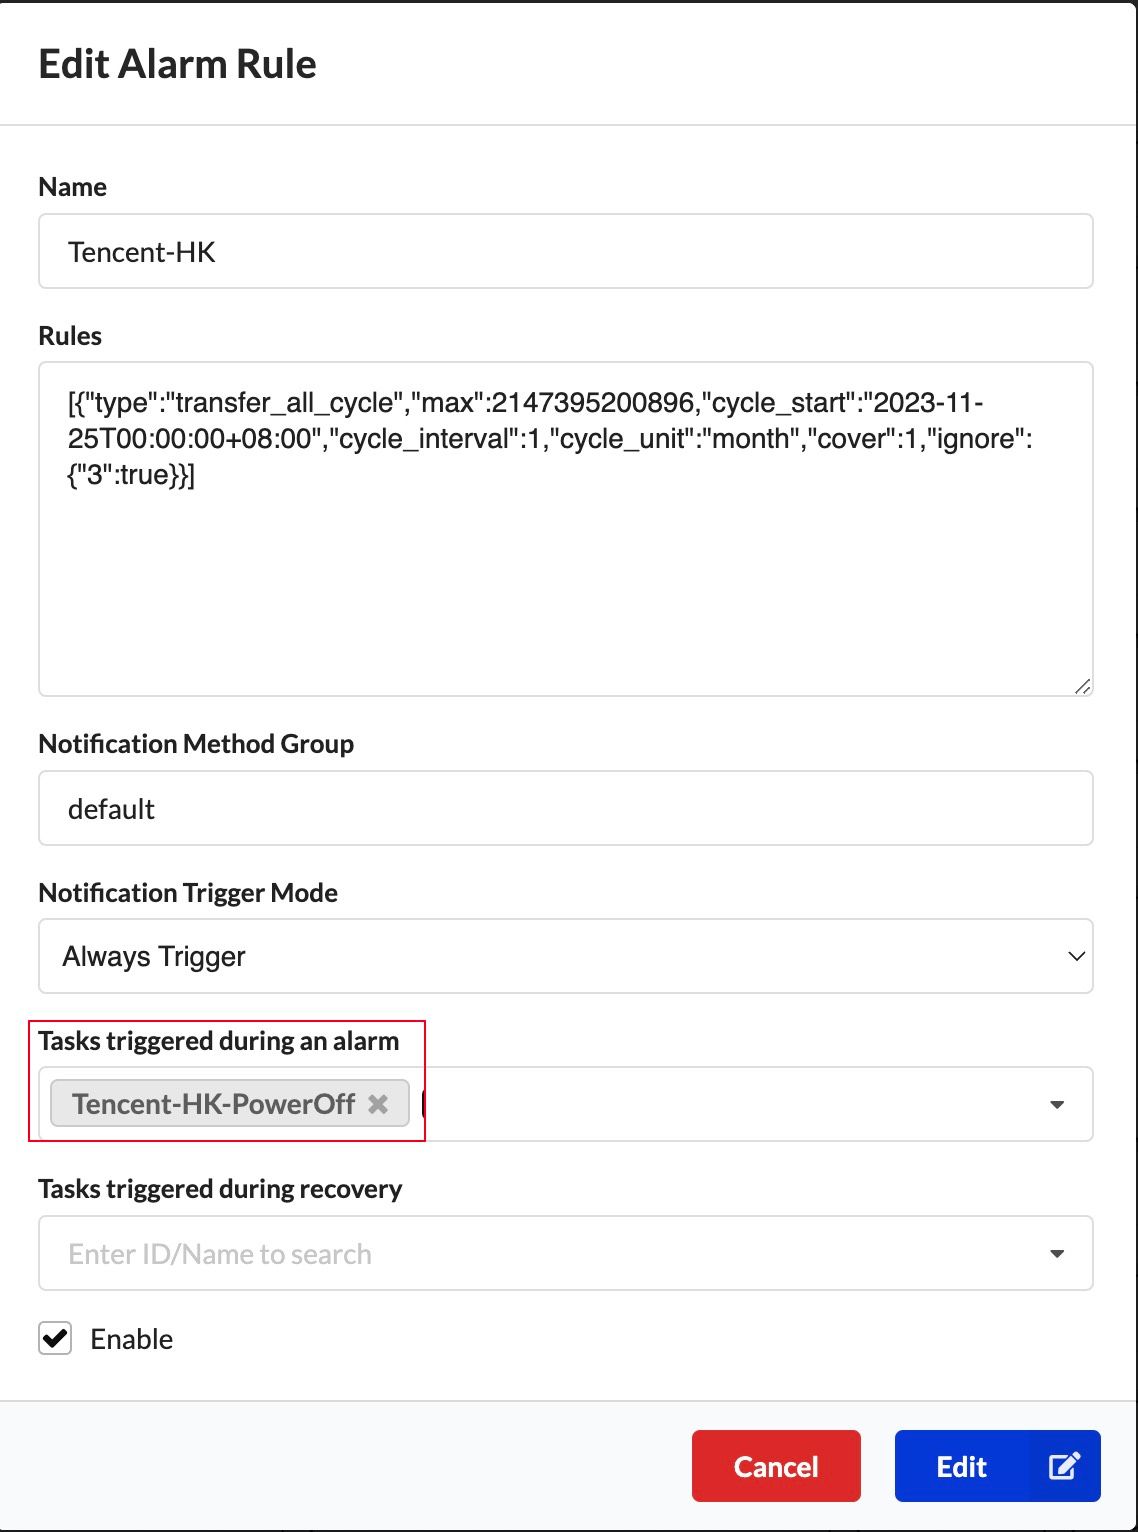
配置告警
Notifications->Add Notification Rule
离线报警
[{"Type":"offline","Duration":10}]
网速报警
[{"Type":"net_out_speed","Duration":10,"max":10485760,"cover":1,"ignore":{"18":true}}]
CPU+内存
CPU 持续 10s 超过 50% 且 内存持续 20s 占用低于 20% 的报警
[{"Type":"cpu","Min":0,"Max":50,"Duration":10},{"Type":"memory","Min":20,"Max":0,"Duration":20}]